
What is an Audiogram?
Audiogram is a graph that records a person’s hearing thresholds across different pitches and loudness levels. The test shows the softest sounds a person can hear, usually in decibels hearing level, at frequencies measured in hertz. Audiograms help identify the degree, type, and pattern of hearing loss in each ear.
Quick Facts About Audiogram
Category
Hearing test result
Measured by
Pure tone audiometry
Used for
Mapping hearing thresholds
Common confusion
Not the same as a speech test
Also called
Hearing chart, Audiometric chart
Often discussed with
Pure Tone Audiometry, Hearing Loss Diagnosis
Key Takeaways About Audiogram
- An audiogram displays hearing thresholds for different pitches and loudness levels.
- The vertical scale shows loudness in decibels, while the horizontal scale shows frequency in hertz.
- Separate symbols usually represent air-conduction results for the right and left ears.
- Audiograms help classify hearing loss as conductive, sensorineural, or mixed.
- Speech understanding and daily listening needs require assessment beyond the graph alone.
Understanding Audiogram
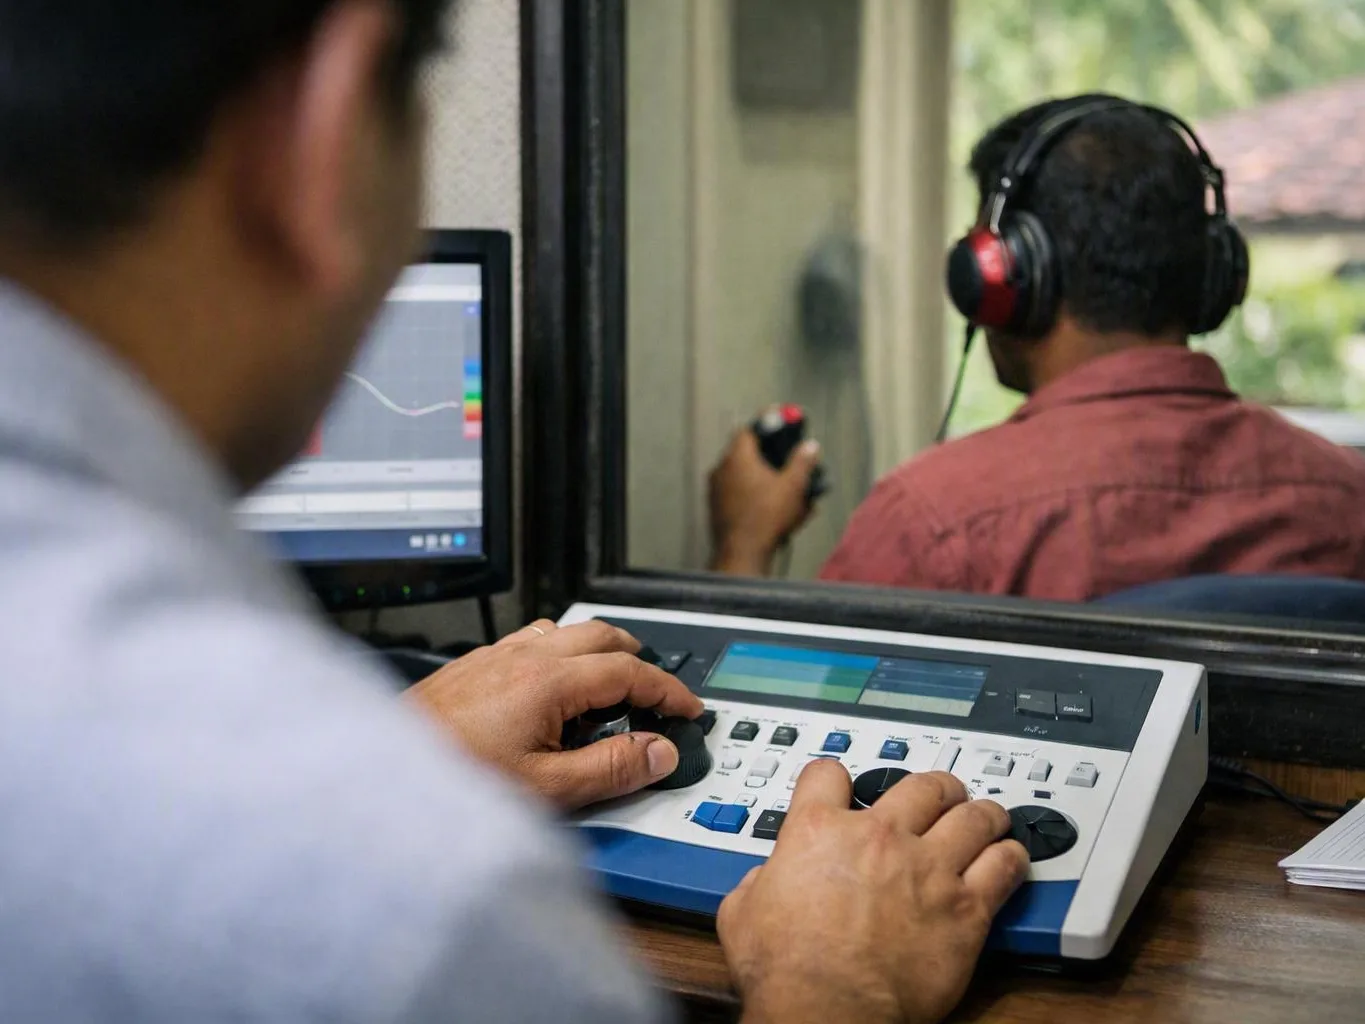
An audiogram is a visual record of hearing sensitivity. It plots the quietest sounds a person detects at selected frequencies, or pitches. Clinicians usually test tones from low-pitched sounds to high-pitched sounds and record each ear separately.
Related glossary terms: Hearing Threshold, Decibel, Conductive Hearing Loss.
The vertical axis shows loudness in decibels hearing level, abbreviated dB HL. Softer sounds appear nearer the top, while louder sounds appear lower on the chart. The horizontal axis shows frequency in hertz, abbreviated Hz, which describes pitch. A mark placed lower on the graph means the person needed a louder sound to detect that frequency.
How Audiogram Works, Is Measured, or Is Used?
A pure tone audiometry test creates the results shown on an audiogram. You listen through headphones or insert earphones while the clinician presents tones at different pitches. You respond whenever you hear a tone, even if it sounds very faint. The clinician reduces or increases the loudness to estimate the softest level detected reliably.
Testing may include air conduction and bone conduction. Air conduction checks the full hearing pathway through headphones or insert earphones. Bone conduction sends vibration through a small device placed behind the ear, which helps assess the inner ear without relying on the outer or middle ear. The difference between these results can help identify the type of hearing loss.
- Right and left ears are normally recorded with different symbols.
- Thresholds are commonly checked at speech-related frequencies and higher frequencies.
- Speech testing may be added to assess word recognition and functional listening.
Why Audiogram Matters?
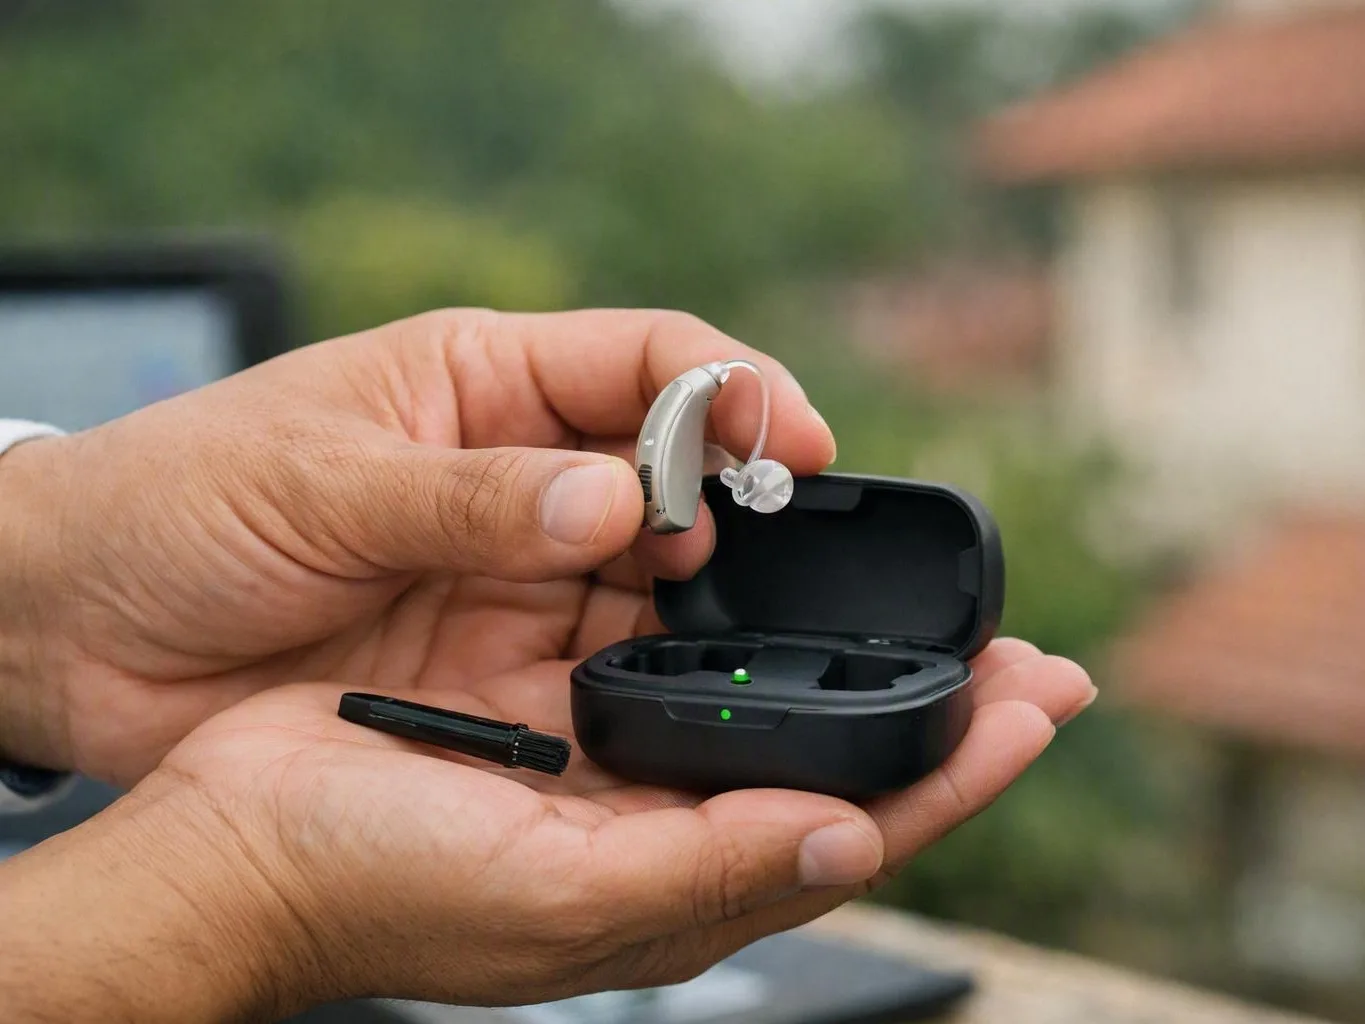
An audiogram helps a clinician measure the degree and pattern of hearing loss rather than relying only on symptoms. Results may show normal sensitivity, mild loss, moderate loss, severe loss, or profound loss, depending on the thresholds and classification system used. The chart can also reveal whether both ears have similar results.
The pattern supports clinical decisions about further assessment and hearing care. A gap between air and bone conduction may suggest conductive hearing loss, while similar reduction across both methods may fit sensorineural hearing loss. Speech perception, medical history, ear examination, and communication needs must still be considered before interpreting the result.
When Audiogram Matters Most?
An audiogram becomes especially useful when you notice difficulty following conversation, asking people to repeat themselves, or increasing the volume of television. It also helps track hearing after repeated workplace noise, ear infections, head injury, or treatment that may affect hearing. A change between two tests may be more meaningful than one isolated result.
Clinicians use the findings when considering hearing aid fitting, communication strategies, or referral for medical assessment. Sudden hearing change, one-sided hearing loss, dizziness, ear pain, or discharge needs prompt clinical attention because an audiogram alone can't explain every cause. Test quality also matters, so the person must understand the instructions and respond consistently.
How to Evaluate Audiogram?
- Check that both ears have separate results and that the test frequencies are clearly labelled.
- Review the air-conduction and bone-conduction pattern for possible conductive, sensorineural, or mixed loss.
- Compare thresholds with speech perception results when understanding conversation is the main concern.
- Look for meaningful changes from earlier audiograms rather than judging one graph without context.
- Confirm that the test environment, earphones, instructions, and responses were suitable for reliable results.
Related Concepts Compared
Audiogram vs. Hearing Threshold
A hearing threshold is the softest level detected at one frequency. An audiogram is the graph that displays several thresholds across frequencies.
Audiogram vs. Pure Tone Audiometry
Pure tone audiometry is the test procedure that measures responses to tones. An audiogram is the recorded chart produced from those measurements.
Audiogram vs. Speech Audiometry
Speech audiometry measures detection or understanding of spoken words. An audiogram usually refers to tone thresholds, although speech results may appear alongside it.
Audiogram vs. Tympanometry
Tympanometry assesses eardrum movement and middle-ear function. It does not measure hearing thresholds or replace an audiogram.
Expert Note
A threshold graph does not show the full effect of hearing loss on communication. Two people with similar audiograms may understand speech differently because of word recognition, listening conditions, cognition, language, and noise exposure.
Common Mistakes or Myths About Audiogram
- Assuming a better-looking graph always means better speech understanding.
- Reading the vertical axis as a simple volume scale rather than a hearing-level scale.
- Comparing two audiograms without checking the test conditions and equipment.
- Treating an audiogram as a diagnosis of the ear problem by itself.
- Ignoring a sudden or one-sided change because the other ear tests normally.
Audiogram in Practice: A Real-World Example
A person’s audiogram may show thresholds near 20 dB HL at low pitches and 55 dB HL at high pitches in both ears. This pattern suggests greater difficulty hearing high-pitched speech sounds, alarms, and speech in background noise, although speech testing is still needed.
Sources & Further Reading on Audiogram
- American Speech-Language-Hearing Association, Audiometric Symbols
- World Health Organisation, World Report on Hearing
Related Services
Related Terms
Hearing Threshold
Hearing Threshold is the quietest sound a person can detect at a specific frequency under defined…
Decibel
Decibel is a logarithmic unit used to express the ratio between two levels of sound intensity…
Conductive Hearing Loss
Conductive Hearing Loss is reduced hearing caused by a problem in the outer or middle ear…
Sensorineural Hearing Loss
Sensorineural Hearing Loss is reduced hearing caused by damage to the cochlea, inner-ear hair cells, or…
Audium Hearing Aid Clinic
Have Questions About Audiogram?
Contact Audium Hearing Aid Clinic for practical guidance on Audiogram and related hearing aid clinic work in Bhubaneswar.